Los Angeles UHI Monitoring
Los Angeles UHI Monitoring
This project monitors the urban heat island effect and the efficacy of future countermeasures in the Los Angeles region.
About
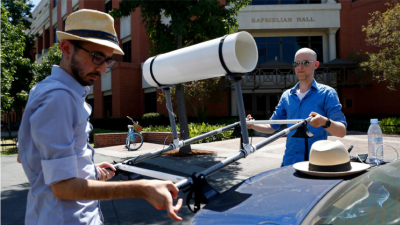
The research team—comprised of members from Lawrence Berkeley National Laboratory, Altostratus Inc., and University of Southern California—set out to understand how changes in neighborhood air temperatures are related to land-use and land-cover properties, such as roof albedo and tree canopy cover. The California Energy Commission sponsored-project used advanced meteorological models and field observations gathered from mobile transects, personal weather station networks, and new research-grade weather monitors for the assessment. To identify the causes of the neighborhood-scale urban heat and cool islands, we collected detailed land-use and land-cover datasets as inputs for the meteorological modeling and analysis.
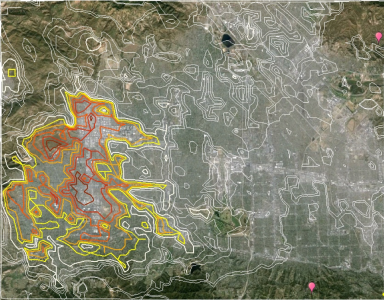
This study was the first to find evidence from analysis of personal weather stations that increases in roof albedo at the neighborhood scale are associated with reductions in near-surface air temperature. This was corroborated with our finding from the mobile transect measurements, which revealed a cooling effect from area-wide increase in albedo (roof, pavement) and/or tree canopy cover.
The work performed in this project helps maximize the benefits from future UHI countermeasures, such as high-albedo roofs and increased vegetation, by (a) verifying through modeling and measurements the relationships between neighborhood-scale urban heat and cool islands, and land-use and land-cover; (b) using the field observations to calibrate and validate the meteorological models used to estimate the benefits of UHI countermeasures; and (c) leaving in place a set of research-grade weather monitors that can be used to track changes in urban temperatures. All of this will further facilitate a more region-optimized deployment of UHI mitigation technologies for California.
We are grateful for the support of our partners—Los Angeles Regional Collaborative for Climate Action and Sustainability, Los Angeles Department of Water and Power, Office of Los Angeles Mayor Eric Garcetti, and Los Angeles Unified School District—as well as our project collaborators—TreePeople, Los Angeles Bureau of Street Services, Climate Resolve, and County of Los Angeles.
For more information, please see our project fact sheet, California Energy Commission Energy Innovation Showcase page, and the publications listed below.
Publications
Taha H, Ban-Weiss G, Chen S, Gilbert H, Goudey H, Ko J, Mohegh A, Rodriguez A, Slack J, Tang T, and Levinson RM. 2018. Modeling and observations to detect neighborhood-scale heat islands and inform effective countermeasures in Los Angeles. A report for California’s Fourth Climate Change Assessment, report # CCCA4-CEC-2018-007.
Taha H, Levinson R, Mohegh A, Gilbert H, Ban-Weiss G, Chen S. 2018. Air-temperature response to neighborhood-scale variations in albedo and canopy cover in the real world: Fine-resolution meteorological modeling and mobile temperature observations in the Los Angeles climate archipelago. Climate 6, 53 (25 pp).
Mohegh A, Levinson R, Taha H, Gilbert H, Zhang J, Li T, Tang T, Ban-Weiss G. 2018. Observational evidence of neighborhood scale reductions in air temperature associated with increases in roof albedo. Climate, 6, 98 (19 pp).
Webinars
Levinson R, Taha H, Mohegh A, Ban-Weiss G, Gilbert H. 2018. Modeling and observations to detect neighborhood-scale heat islands and inform effective countermeasures in Los Angeles. Energy Sector Adaption Webinar, California Energy Commission, December 5. Presentation slides and recording.
New Weather Monitors
We installed four new research-grade weather monitors in Los Angeles. Their data is available from the Weather Underground network via the following links: